Unit 2.3 Extracting Information from Data, Pandas
Data connections, trends, and correlation. Pandas is introduced as it could be valuable for PBL, data validation, as well as understanding College Board Topics.


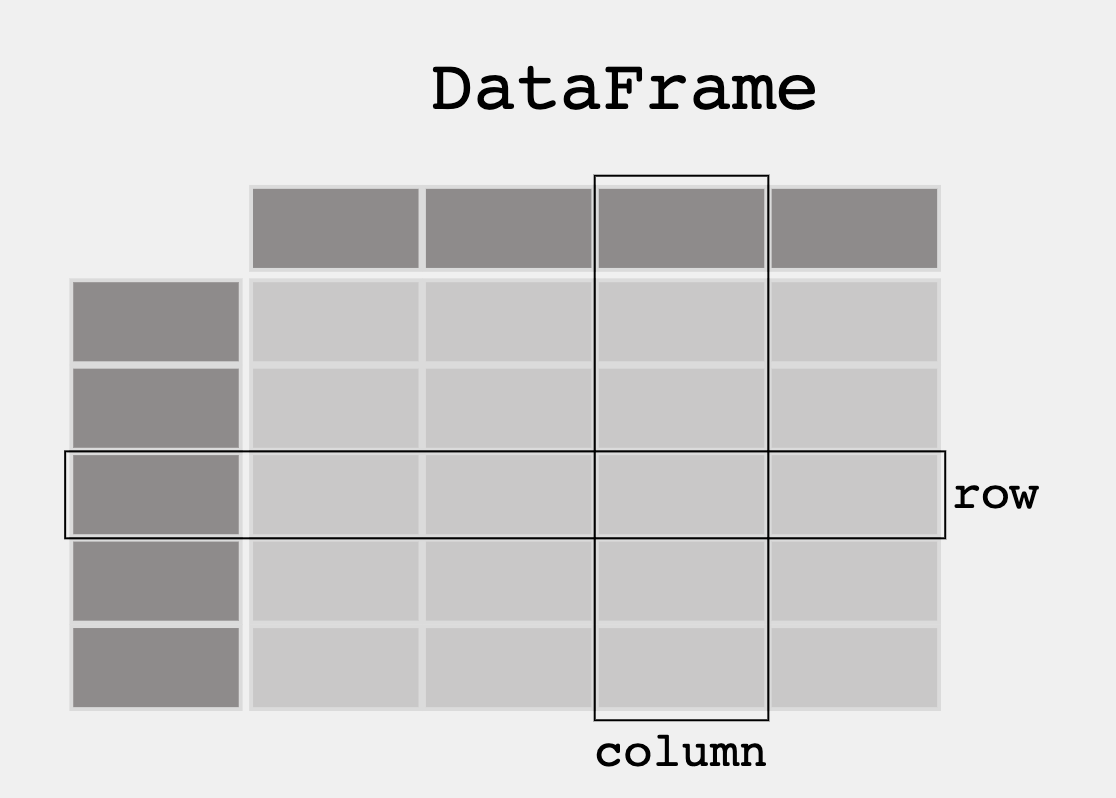
Pandas and DataFrames
In this lesson we will be exploring data analysis using Pandas.
- College Board talks about ideas like
- Tools. "the ability to process data depends on users capabilities and their tools"
- Combining Data. "combine county data sets"
- Status on Data"determining the artist with the greatest attendance during a particular month"
- Data poses challenge. "the need to clean data", "incomplete data"
- From Pandas Overview -- When working with tabular data, such as data stored in spreadsheets or databases, pandas is the right tool for you. pandas will help you to explore, clean, and process your data. In pandas, a data table is called a DataFrame.
'''Pandas is used to gather data sets through its DataFrames implementation'''
import pandas as pd
df = pd.read_json('files/grade.json')

print(df)
# What part of the data set needs to be cleaned?
# From PBL learning, what is a good time to clean data?  Hint, remember Garbage in, Garbage out?
print(df[['GPA']])

print()

#try two columns and remove the index from print statement
print(df[['Student ID','GPA']].to_string(index=False))
Notes and Observations #2
Two separate print statements:
1: Uses double brackets to extract a single column (GPA) of data from the DataFrame.
- Output: GPA column only.
2: Uses double brackets to extract two columns of data from the DataFrame: "Student ID" and "GPA".
Printed using the "to_string()" method.
The "index=False" argument ensures that the DataFrame is printed without row numbers.
DataFrame Sort
print(df.sort_values(by=['GPA']))

print()

#sort the values in reverse order
print(df.sort_values(by=['GPA'], ascending=False))
Notes and Observations #3
Two separate print statements
1: Uses the "sort_values()" method to sort the DataFrame by the "GPA" column from lowest to highest.
- Output: DataFrame that displays the rows sorted by GPA from lowest to highest.
2: Uses the same "sort_values()" method
The "ascending" argument is set to "False"
Output: new DataFrame that displays the rows sorted by GPA from highest to lowest.
DataFrame Selection or Filter
print(df[df.GPA > 3.00])
print(df[df.GPA == df.GPA.max()])
print()
print(df[df.GPA == df.GPA.min()])
Notes and Observations #5
Uses Pandas to filter data from a DataFrame based on the maximum and minimum values of the "GPA" column.
Two separate print statements:
1: Uses boolean indexing to select only the rows where the "GPA" column is equal to the maximum value of the "GPA" column.
max(): Used to find the maximum value in the "GPA" column.Compared to the entire "GPA" column using the
==operator.Output: New DataFrame that contains only the rows where the "GPA" column is equal to the maximum value of the "GPA" column.
2: Uses boolean indexing to select only the rows where the "GPA" column is equal to the minimum value of the "GPA" column.
min(): Used to find the minimum value in the "GPA" column.Compared to the entire "GPA" column using the
==operator.Output: New DataFrame that contains only the rows where the "GPA" column is equal to the minimum value of the "GPA" column.
Create your own DataFrame
Using Pandas allows you to create your own DataFrame in Python.
Python Dictionary to Pandas DataFrame
import pandas as pd

#the data can be stored as a python dictionary
dict = {
  "calories": [420, 380, 390, 500],
  "duration": [50, 40, 45, 55]
}
#stores the data in a data frame
print("-------------Dict_to_DF------------------")
df = pd.DataFrame(dict)
print(df)

print("----------Dict_to_DF_labels--------------")

#or with the index argument, you can label rows.
df = pd.DataFrame(dict, index = ["day1", "day2", "day3", "day4"])
print(df)
Notes and Observations #6
Imports the pandas library using the shorthand
pd.Creates a dictionary named
dictthat contains two lists:caloriesduration
Converts the dictionary
dictinto a Pandas DataFrame.- The resulting DataFrame is printed to the console using the
print()function.
- The resulting DataFrame is printed to the console using the
Creates another DataFrame by passing the dictionary
dictas well as a list of strings as arguments to thepd.DataFrame()method.- DataFrame is printed to the console using the
print()function.
- DataFrame is printed to the console using the
Examine DataFrame Rows
print("-------Examine Selected Rows---------")
#use a list for multiple labels:
print(df.loc[["day1", "day3"]])

#refer to the row index:
print("--------Examine Single Row-----------")
print(df.loc["day1"])
Notes and Observations #6
Prints the string
-------Examine Selected Rows---------to the console using theprint()function.Selects and prints specific rows of the DataFrame
dfusing theloc[]method and a list of strings.Prints the string
--------Examine Single Row-----------to the console using theprint()function.Selects and prints a single row of the DataFrame
dfusing theloc[]method and a single string.
Pandas DataFrame Information
print(df.info())
import pandas as pd

#read csv and sort 'Duration' largest to smallest
df = pd.read_csv('files/data.csv').sort_values(by=['Duration'], ascending=False)

print("--Duration Top 10---------")
print(df.head(10))

print("--Duration Bottom 10------")
print(df.tail(10))
Notes and Observations #8
Imports the pandas library using the shorthand
pd.Reads in a CSV file named
data.csvusing thepd.read_csv()method and stores the resulting DataFrame in a variable nameddf.Sorts the DataFrame
dfin descending order based on the values in theDurationcolumn using thesort_values()method.Prints the string
--Duration Top 10---------to the console using theprint()function.Selects and prints the first 10 rows of the sorted DataFrame
dfusing thehead()method.Prints the string
--Duration Bottom 10------to the console using theprint()function.Selects and prints the last 10 rows of the sorted DataFrame
dfusing thetail()method.
APIs are a Source for Writing Programs with Data
3rd Party APIs are a great source for creating Pandas Data Frames.
- Data can be fetched and resulting json can be placed into a Data Frame
- Observe output, this looks very similar to a Database
'''Pandas can be used to analyze data'''
import pandas as pd
import requests

def fetch():
    '''Obtain data from an endpoint'''
    url = "https://flask.nighthawkcodingsociety.com/api/covid/"
    fetch = requests.get(url)
    json = fetch.json()

    # filter data for requirement
    df = pd.DataFrame(json['countries_stat'])  # filter endpoint for country stats
    print(df.loc[0:5, 'country_name':'deaths']) # show row 0 through 5 and columns country_name through deaths

fetch()
Notes and Observations #9
Imports the pandas library using the shorthand
pdand the requests library.Defines a function named
fetch()that retrieves data from a remote server.Creates a variable named
urlthat contains the URL of the remote server endpoint.Sends a
GETrequest to the remote server using therequests.get()method and stores the response in a variable namedfetch.Retrieves the JSON content from the response using the
fetch.json()method and stores the resulting dictionary in a variable namedjson.Creates a new DataFrame named
dfby passing thecountries_statkey from thejsondictionary to thepd.DataFrame()method.Selects and prints the first 6 rows and the columns from
country_nametodeathsusing theloc[]method and theprint()function.Calls itself to execute the code .
CB 2.3

The Extracting Information from Data Quiz and Using Programs with Data quizzes were relatively harder than the topics discussed in 2.2, but I was able to complete both quizzes with ease and I only missed one problem. However, there were some questions that were trickier than others. There were also a lot of high-quality notes.
Extracting Information from Data
Challenge in analyzing data from many counties
A team of researchers wants to create a program to analyze the amount of pollution reported in roughly 3,000 counties across the United States. The program is intended to combine county data sets and then process the data. Which of the following is most likely to be a challenge in creating the program?
A: A computer program cannot combine data from different files.
B: Different counties may organize data in different ways.
C: The number of counties is too large for the program to process.
D: The total number of rows of data is too large for the program to process.
Answer: Different counties may organize data in different ways. It will be a challenge to clean the data from the different counties to make the data uniform. The way pollution data is captured and organized may vary significantly from county to county.
Using Programs with Data Quiz
Bookstore spreadsheet
A large spreadsheet contains the following information about the books at a bookstore. A sample portion of the spreadsheet is shown below.
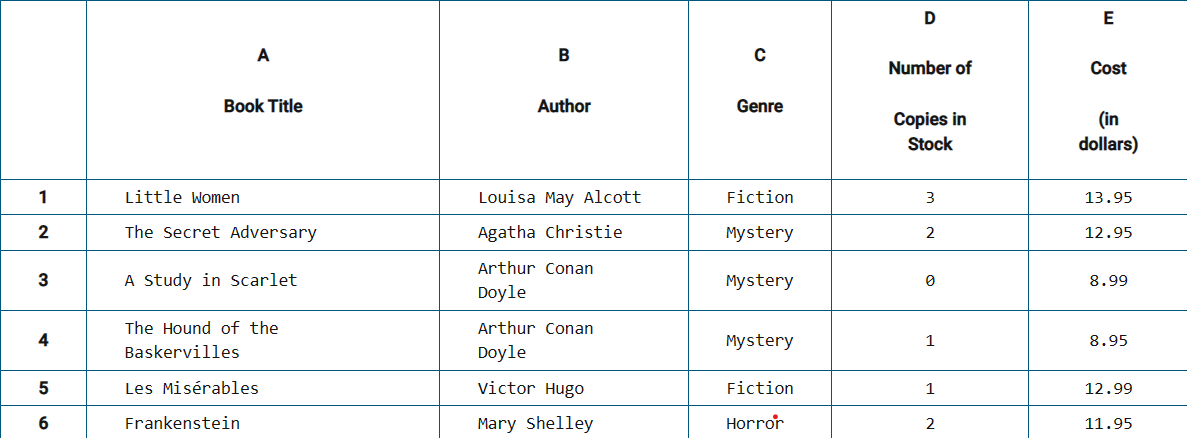
An employee wants to count the number of books that meet all of the following criteria.
Is a mystery book
Costs less than $10.00
Has at least one copy in stock
For a given row in the spreadsheet, suppose genre contains the genre as a string, num contains the number of copies in stock as a number, and cost contains the cost as a number. Which of the following expressions will evaluate to true if the book should be counted and evaluates to false otherwise?
A: (genre = "mystery") AND ((1 ≤ num) AND (cost < 10.00))
B: (genre = "mystery") AND ((1 < num) AND (cost < 10.00))
C: (genre = "mystery") OR ((1 ≤ num) OR (cost < 10.00))
D: (genre = "mystery") OR ((1 < num) OR (cost < 10.00))
Answer: (genre = "mystery") AND ((1 ≤ num) AND (cost < 10.00)). For a book to be counted, the value of genre must be "mystery" so that only mystery books are counted. The value of num must be greater than or equal to 1 so that only books that have at least one copy in stock are counted. The value of cost must be less than 10.00 so that only books that cost less than $10 are counted. All three conditions must be true, so the AND operator is used between them.
Clothing store sales information
The owner of a clothing store records the following information for each transaction made at the store during a 7-day period.
The date of the transaction
The method of payment used in the transaction
The number of items purchased in the transaction
The total amount of the transaction, in dollars
Customers can pay for purchases using cash, check, a debit card, or a credit card.
Using only the data collected during the 7-day period, which of the following statements is true?
A: The average amount spent per day during the 7-day period can be determined by sorting the data by the total transaction amount, then adding the 7 greatest amounts, and then dividing the sum by 7.
B: The method of payment that was used in the greatest number of transactions during the 7-day period can be determined by sorting the data by the method of payment, then adding the number of items purchased for each type of payment method, and then finding the maximum sum.
C: The most expensive item purchased on a given date can be determined by searching the data for all items purchased on the given date and then sorting the matching items by item price.
D: The total number of items purchased on a given date can be determined by searching the data for all transactions that occurred on the given date and then adding the number of items purchased for each matching transaction.
Answer: The total number of items purchased on a given date can be determined by searching the data for all transactions that occurred on the given date and then adding the number of items purchased for each matching transaction.For each transaction, the data includes the date of the transaction and the number of items purchased in the transaction. By searching the data to find all transactions that occurred on the given date, and then adding the number of items purchased in each of those transactions, the total number of items purchased on a given date can be determined.
Use of databases to display animal information
A wildlife preserve is developing an interactive exhibit for its guests. The exhibit is intended to allow guests to select the name of an animal on a touch screen and display various facts about the selected animal.
For example, if a guest selects the animal name “wolf,” the exhibit is intended to display the following information.
Classification: mammal
Skin type: fur
Thermoregulation: warm-blooded
Lifestyle: pack
Average life span: 10–12 years
Top speed: 75 kilometers/hour
The preserve has two databases of information available to use for the exhibit. The first database contains information for each animal’s name, classification, skin type, and thermoregulation. The second database contains information for each animal’s name, lifestyle, average life span, and top speed.
Which of the following explains how the two databases can be used to develop the interactive exhibit?
A: Only the first database is needed. It can be searched by animal name to find all the information to be displayed.
B: Only the second database is needed. It can be searched by animal name to find all the information to be displayed.
C: Both databases are needed. Each database can be searched by animal name to find all information to be displayed.
D: The two databases are not sufficient to display all the necessary information because the intended display information does not include the animal name.
Answer: Both databases are needed. Each database can be searched by animal name to find all information to be displayed. The information to be displayed comes from both databases. The animal name can be used search the first database to find the classification, skin type, and thermoregulation information. The animal name can be used search the second database to find the lifestyle, average life span, and top speed information.
Album Dataset Stuff
import json

with open('files/album.json', 'r') as f:
    albums_data = json.load(f)

def get_album_info(album_name):
    album_id = albums_data["Album ID"].get(album_name)
    if album_id is None:
        return "Album not found"

    album_creator = albums_data["Creator"][album_name]

    album_year = albums_data["Year"][album_name]

    return f"Album ID: {album_id}\nCreator: {album_creator}\nYear of release: {album_year}"

print(get_album_info("Kid A"))
print(get_album_info("In Rainbows"))
print(get_album_info("Dummy"))
print(get_album_info("Graduation"))
import json

with open('files/album.json', 'r') as f:
    albums_data = json.load(f)

def get_album_stats(albums_data):
    total_albums = len(albums_data["Album ID"])

    creator_counts = {}
    for album in albums_data["Creator"]:
        creator = albums_data["Creator"][album]
        if creator in creator_counts:
            creator_counts[creator] += 1
        else:
            creator_counts[creator] = 1

    years = albums_data["Year"].values()
    avg_year = sum(years) / len(years)

    oldest_album = min(albums_data["Year"], key=albums_data["Year"].get)
    newest_album = max(albums_data["Year"], key=albums_data["Year"].get)

    stats_str = (
        f"Total albums: {total_albums}\n"
        f"Albums per creator: {creator_counts}\n"
        f"Average year of release: {avg_year:.2f}\n"
        f"Oldest album: {oldest_album}\n"
        f"Newest album: {newest_album}\n"
    )
    return stats_str

album_stats = get_album_stats(albums_data)
print(album_stats)